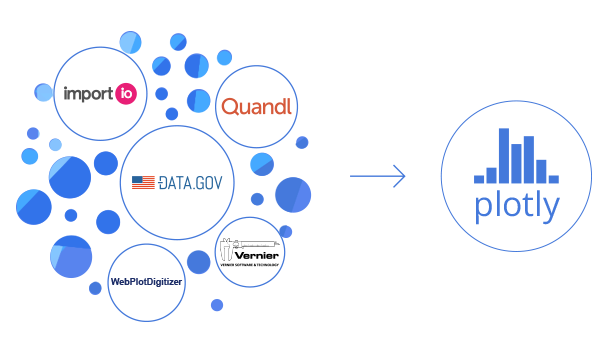
Export to Plotly
Learn how you can build a data exporter for your site, to easily send data from your web site to graph in Plotly. Plotly offers a clean, simple, and beautiful visualization tool for your data and your users.
Follow the steps belowQuestions? community.plotly.com
Plotly makes it easy to share and edit your work privately, with your co-workers, or the world. There is so much to learn from open government data and we are happy to feature tools like Plotly and CartoDB that make it easier for everyone to become a data scientist.

Why did we choose Plotly for our first integration? Because we’re a great match! Both our platforms are designed to make the power of data more accessible.

See it in action
View a showcase of how our partners are using the export option and how it is benefiting their users.
Read the article

I. Export data into Plotly from an existing endpoint
a. Inline implementation
For this example, we’re using this endpoint from Quandl.
b. Sync Plotly graphs with arbitrary externally sourced data
You can also sync Plotly graphs with arbitrary externally sourced data. These graphs can be shared by a URL and embedded in a webpage, and whenever a user views the graph, Plotly fetches the latest data from your web service.
Use the external source plotter when you don’t want to send your user to Plotly’s web-app.
We have examples documented for
SQLite,
Flask,
Quandl,
Google Drive,
GitHub Gists, and
Dropbox.
See it in action or read more about it
II. Export data into a Plotly spreadsheet for easy graphing
1. Create a button or link on your page with an ID "plotly-data-export". Make sure your page is loading jQuery.
<a href="#" id="plotly-data-export" target="_blank">Graph in Plotly</a>
2. Create a global JavaScript function called getPlotlyGridData(). This function should return the data you want to be available to graph. See the code below for the correct syntax. In this example, "Data", "Amount", and "Source" will be column headers in the Plotly spreadsheet.
        <script>
        function getPlotlyGridData(){
            return {"cols":{
                "Date":{"data":[1, 2, 4, 2, 6, 3]},
                "Amount":{"data":[3, 4, 6, 1, 9, 2]},
                "Source":["data.gov","2013-11-11"]},
                "meta":{}
                }
            }
        }
        </script>
3. Copy and paste the code below and insert it below the body tag of your page.
    <script>
        $('#plotly-data-export').click(function(){
            var hiddenform = $('<div id="hiddenform" '+
                'style="display:none;">'+
                '<form action="https://plotly.com/datagrid" '+
                'method="post" target="_blank">'+
                '<input type="text" '+
                'name="data" /></form></div>')
                .appendTo('body');
            hiddenform.find('input').val(
                JSON.stringify( getPlotlyGridData() ) );
            hiddenform.find('form').submit();
            hiddenform.remove();
        });
    </script>
III. Export data directly into a Plotly graph
1. Create a button or link on your page with an ID "plotly-graph-export". Make sure your page is loading jQuery.
<a href="#" id="plotly-graph-export" target="_blank">Graph in Plotly</a>
2. Create a global JavaScript called getPlotlyGraphData(). This function should return the data you want to graph. See the code below for the correct syntax.
        <script>
        function getPlotlyGraphData(){
            return [{"x":[1,2,3],"y":[2,4,3]},{"x":[1,2,3],"y":[9,7,8]}];
        }
        </script>
3. Copy and paste the code below and insert it below the body tag of your page.
<script> function getPlotlyGridData(){ return {'cols':{ 'Date':{'data':[1, 2]}, 'Amount':{'data':[3, 4]}, 'Source':['data.gov','2013-11-11']}, 'meta':{} }; } $('#plotly-data-export').click(function(){ var hiddenform = $('<div id="hiddenform" '+ 'style="display:none;">'+ '<form action="https://plotly.com/datagrid" '+ 'method="post" target="_blank">'+ '<input type="text" '+ 'name="data" /></form></div>') .appendTo('body'); hiddenform.find('input').val( JSON.stringify( getPlotlyGridData())); hiddenform.find('form').submit(); hiddenform.remove(); }); </script>


