Edit chart
Loading graph
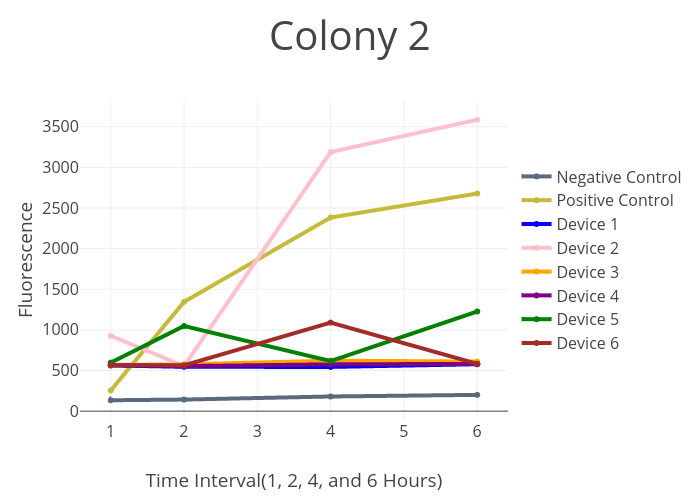
Crookedway's interactive graph and data of "Colony 2" is a scatter chart, showing Negative Control, Positive Control, Device 1, Device 2, Device 3, Device 4, Device 5, Device 6; with Time Interval(1, 2, 4, and 6 Hours) in the x-axis and Fluorescence in the y-axis.. The x-axis shows values from 0.7036541889483066 to 6.296345811051694. The y-axis shows values from -84.12087912087912 to 3804.120879120879.