Edit chart
Loading graph
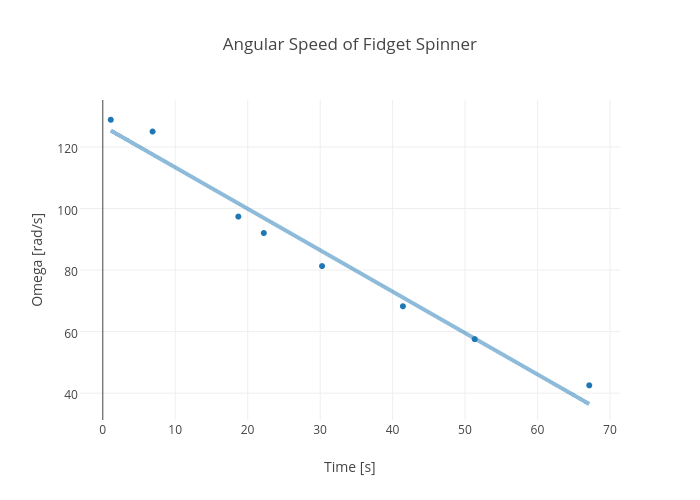
Dink's interactive graph and data of "Angular Speed of Fidget Spinner" is a scatter chart, showing omega; with Time [s] in the x-axis and Omega [rad/s] in the y-axis.. The x-axis shows values from -3.0090398897939625 to 71.24153988979396. The y-axis shows values from 31.26770723325452 to 135.35207491632224. This visualization has the following annotation: $$R^2 = 0.9729\\-1.346\cdot x+126.8$$