Edit chart
Loading graph
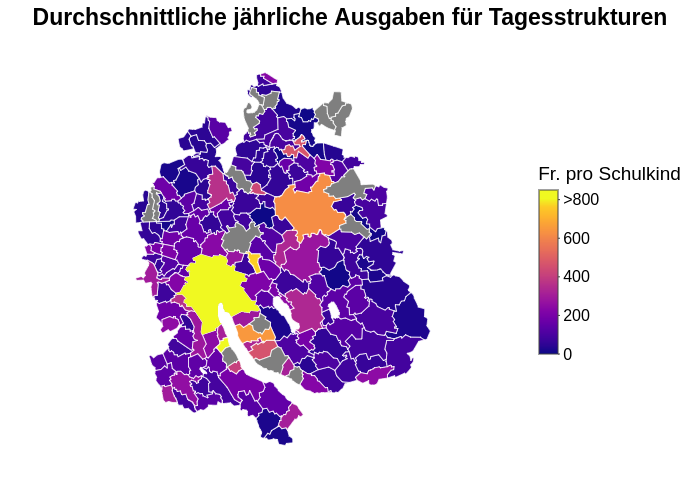
Glonas's interactive graph and data of " Durchschnittliche jährliche Ausgaben für Tagesstrukturen " is a filled line chart, showing 99_c79678d21ee0221e869f54852efebe38. The x-axis shows values from 2653288.1115043014 to 2730698.317623992. The y-axis shows values from 1237147.099 to 1270177.154.