Edit chart
Loading graph
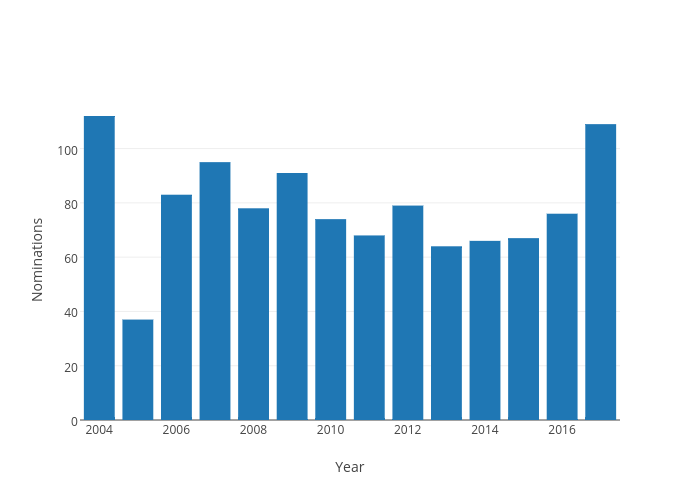
Hjordor's interactive graph and data of "Nominations vs Year" is a filled bar chart, showing Nominations; with Year in the x-axis and Nominations in the y-axis.. The x-axis shows values from 2003.5 to 2017.5. The y-axis shows values from 0 to 117.89473684210526.