Edit chart
Loading graph
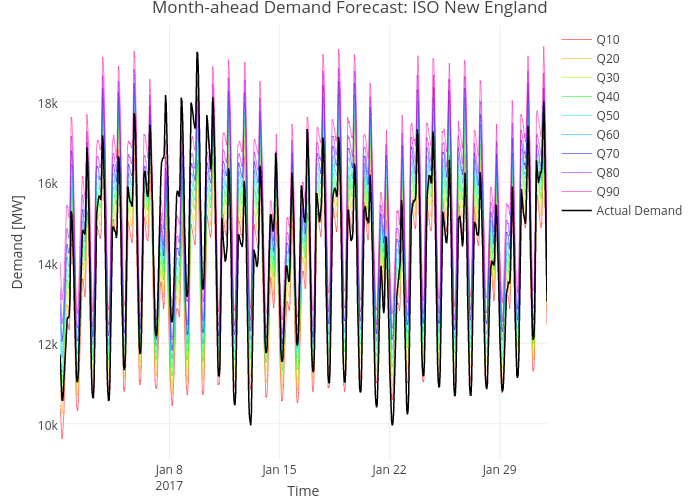
Jbrowell's interactive graph and data of "Month-ahead Demand Forecast: ISO New England" is a line chart, showing Q10, Q20, Q30, Q40, Q50, Q60, Q70, Q80, Q90, Actual Demand; with Time in the x-axis and Demand [MW] in the y-axis.. The x-axis shows values from 0 to 0. The y-axis shows values from 0 to 0.