Edit chart
Loading graph
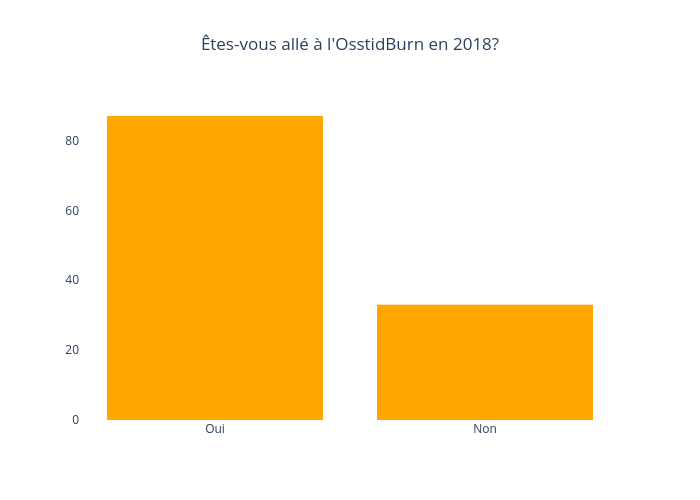
Jodymcintyre's interactive graph and data of "Êtes-vous allé à l'OsstidBurn en 2018?" is a bar chart. The x-axis shows values from -0.5 to 1.5. The y-axis shows values from 0 to 91.57894736842105.