Edit chart
Loading graph
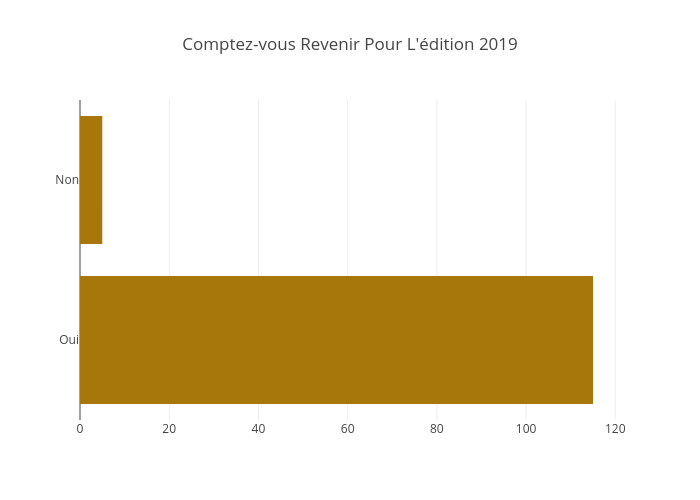
Jodymcintyre's interactive graph and data of "Comptez-vous Revenir Pour L'édition 2019" is a bar chart. The x-axis shows values from 0 to 121.05263157894737. The y-axis shows values from -0.5 to 1.5.