Edit chart
Loading graph
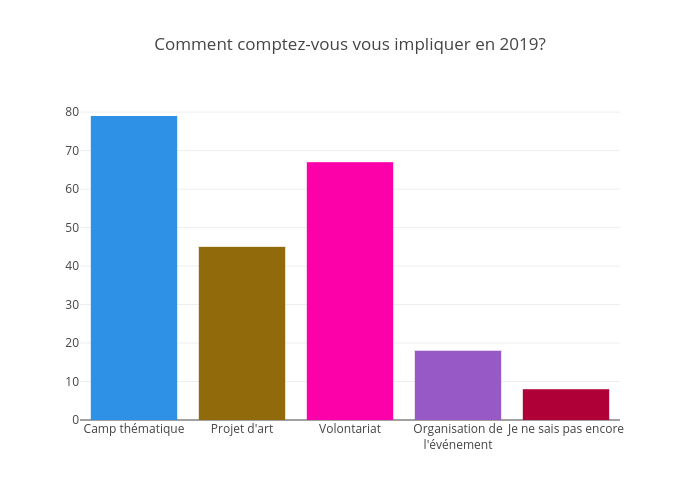
Jodymcintyre's interactive graph and data of "Comment comptez-vous vous impliquer en 2019?" is a bar chart. The x-axis shows values from -0.5 to 4.5. The y-axis shows values from 0 to 83.15789473684211.