Edit chart
Loading graph
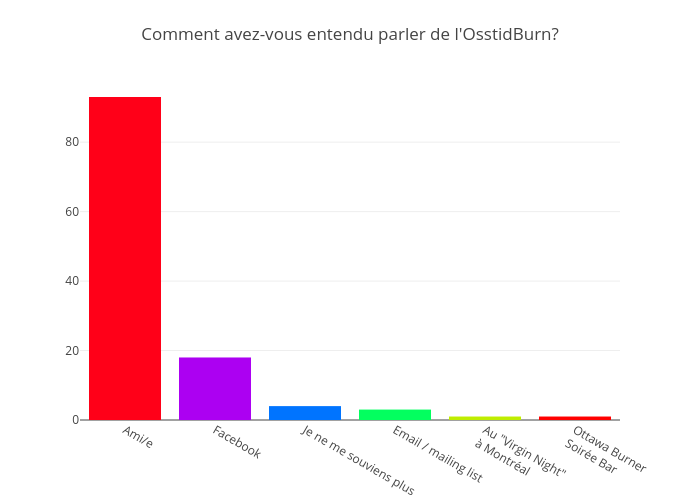
Jodymcintyre's interactive graph and data of "Comment avez-vous entendu parler de l'OsstidBurn?" is a bar chart. The x-axis shows values from -0.5 to 5.5. The y-axis shows values from 0 to 97.89473684210526.