Edit chart
Loading graph
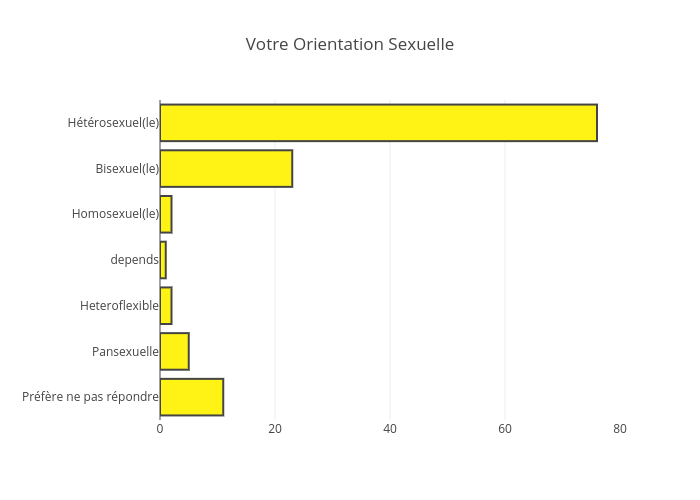
Jodymcintyre's interactive graph and data of "Votre Orientation Sexuelle" is a bar chart. The x-axis shows values from 0 to 80. The y-axis shows values from -0.5 to 6.5.