Edit chart
Loading graph
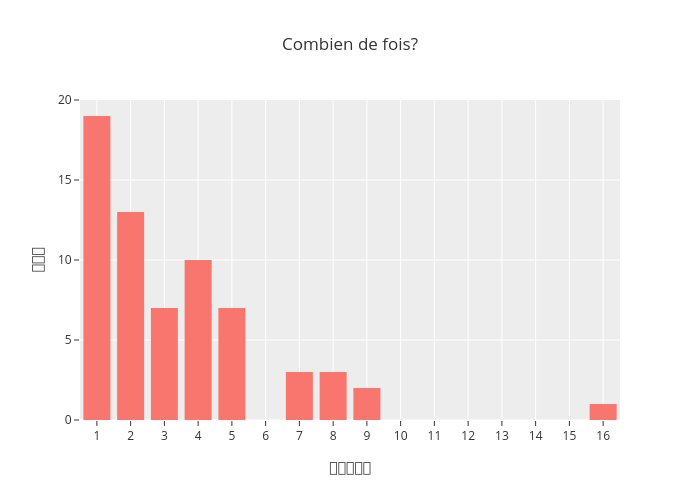
Jodymcintyre's interactive graph and data of "Combien de fois?" is a bar chart; with 🔥🔥🔥🔥🔥 in the x-axis and 🔥🔥🔥 in the y-axis.. The x-axis shows values from 0.5 to 16.5. The y-axis shows values from 0 to 20.