Edit chart
Loading graph
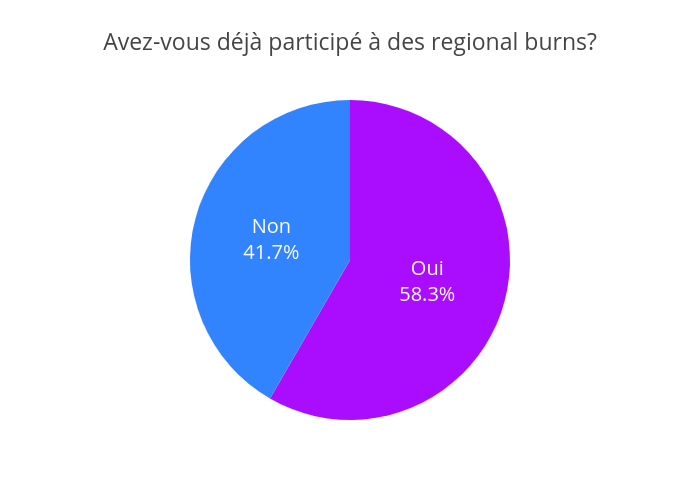
Jodymcintyre's interactive graph and data of "Avez-vous déjà participé à des regional burns?" is a pie. The x-axis shows values from -1 to 6. The y-axis shows values from -1 to 4.