Edit chart
Loading graph
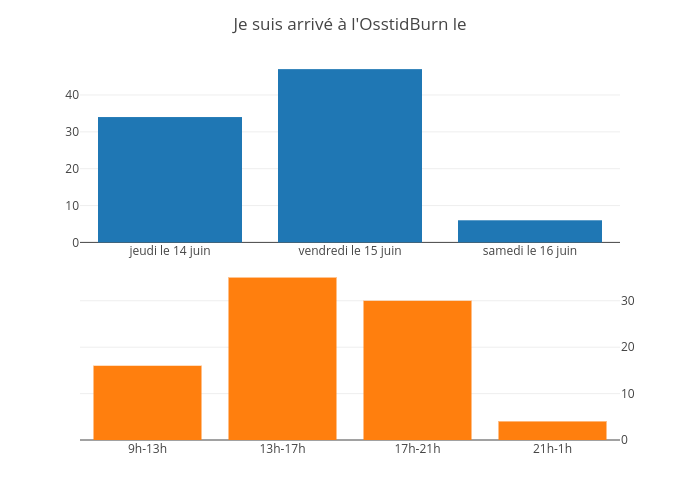
Jodymcintyre's interactive graph and data of "Je suis arrivé à l'OsstidBurn le" is a bar chart. The x-axis shows values from -0.5 to 2.5. The y-axis shows values from 0 to 49.473684210526315.