Edit chart
Loading graph
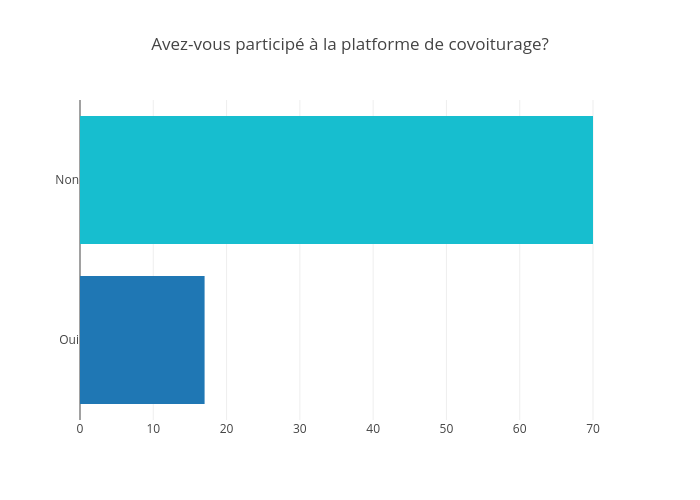
Jodymcintyre's interactive graph and data of "Avez-vous participé à la platforme de covoiturage?" is a bar chart. The x-axis shows values from 0 to 73.6842105263158. The y-axis shows values from -0.5 to 1.5.