Edit chart
Loading graph
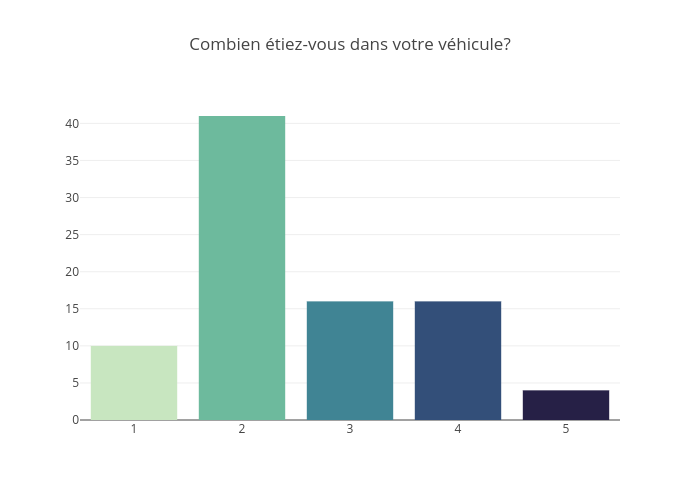
Jodymcintyre's interactive graph and data of "Combien étiez-vous dans votre véhicule?" is a bar chart. The x-axis shows values from 0.5 to 5.5. The y-axis shows values from 0 to 43.1578947368421.