Edit chart
Loading graph
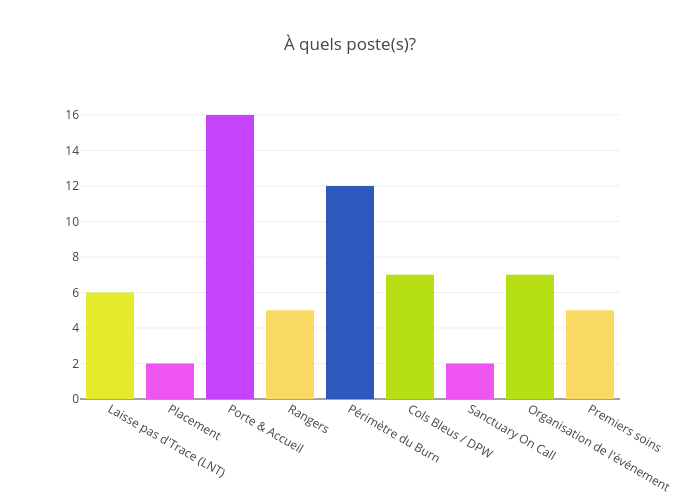
Jodymcintyre's interactive graph and data of "À quels poste(s)?" is a bar chart. The x-axis shows values from -0.5 to 8.5. The y-axis shows values from 0 to 16.842105263157894.