Edit chart
Loading graph
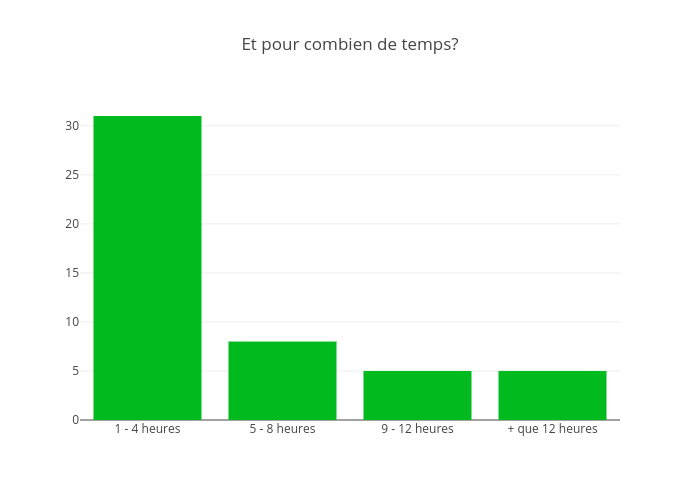
Jodymcintyre's interactive graph and data of "Et pour combien de temps?" is a bar chart. The x-axis shows values from -0.5 to 3.5. The y-axis shows values from 0 to 32.63157894736842.