Edit chart
Loading graph
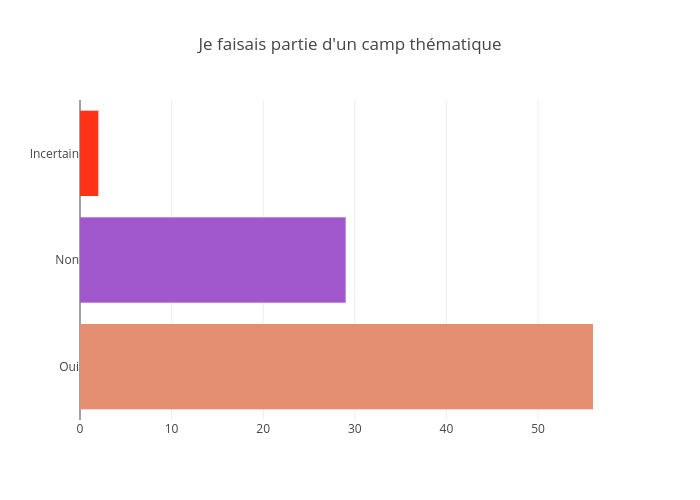
Jodymcintyre's interactive graph and data of "Je faisais partie d'un camp thématique" is a bar chart. The x-axis shows values from 0 to 58.94736842105263. The y-axis shows values from -0.5 to 2.5.