Edit chart
Loading graph
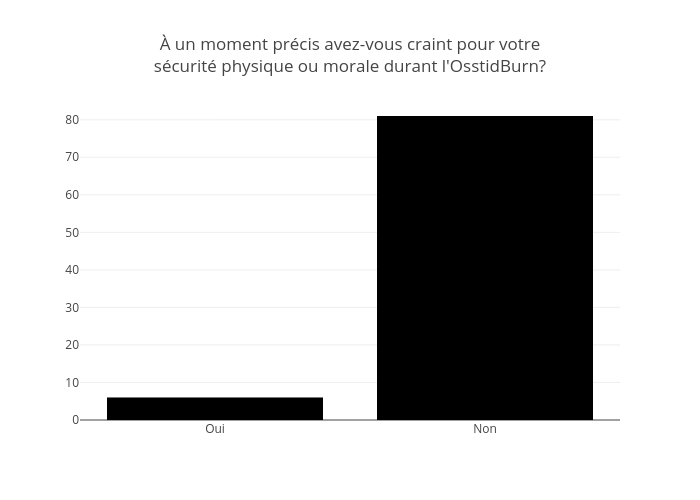
Jodymcintyre's interactive graph and data of "À un moment précis avez-vous craint pour votresécurité physique ou morale durant l'OsstidBurn?" is a bar chart. The x-axis shows values from -0.5 to 1.5. The y-axis shows values from 0 to 85.26315789473684.