Edit chart
Loading graph
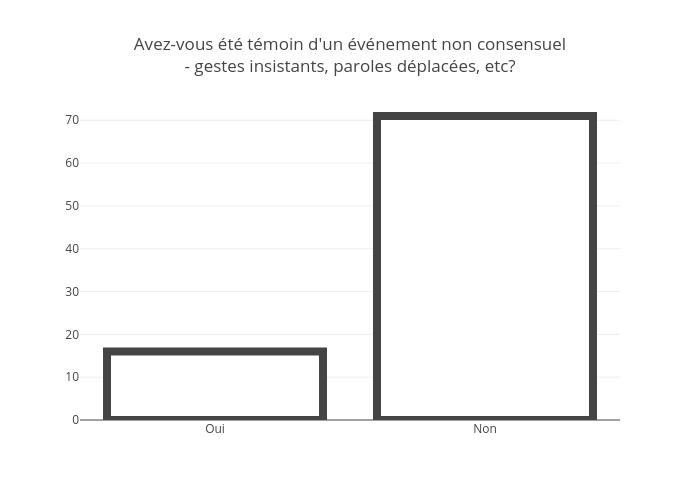
Jodymcintyre's interactive graph and data of "Avez-vous été témoin d'un événement non consensuel- gestes insistants, paroles déplacées, etc?" is a bar chart. The x-axis shows values from -0.5 to 1.5. The y-axis shows values from 0 to 74.73684210526315.