Edit chart
Loading graph
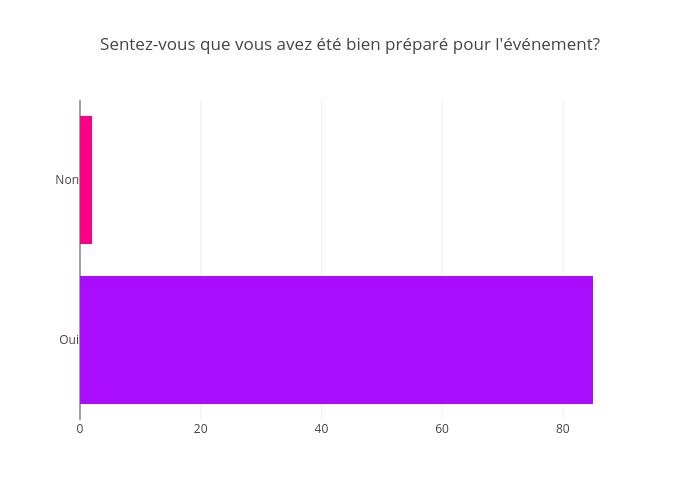
Jodymcintyre's interactive graph and data of "Sentez-vous que vous avez été bien préparé pour l'événement?" is a bar chart. The x-axis shows values from 0 to 89.47368421052632. The y-axis shows values from -0.5 to 1.5.