Edit chart
Loading graph
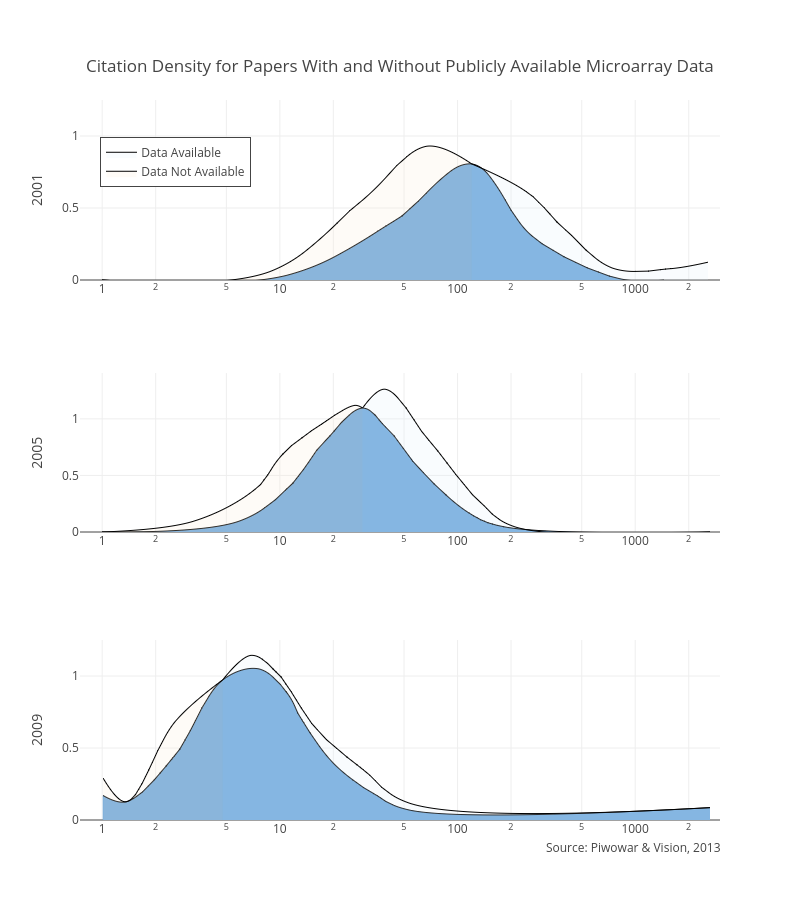
Mattsundquist's interactive graph and data of "Citation Density for Papers With and Without Publicly Available Microarray Data" is a filled line chart, showing , Data N/A, Data Avail., , Data N/A, Data Avail., , Data Not Available, Data Available; with 2009 in the y-axis. The x-axis shows values from -0.12493873660829993 to 3.4771212547196617. The y-axis shows values from 0 to 1.25. This visualization has the following annotation: Source: Piwowar & Vision, 2013