Edit chart
Loading graph
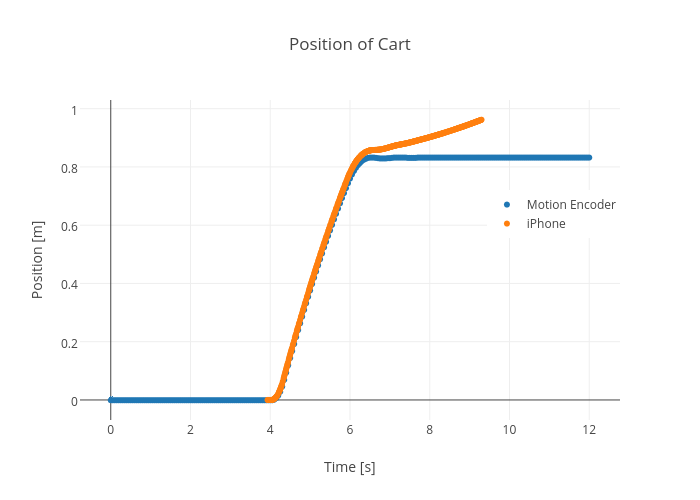
Rhettallain's interactive graph and data of "Position of Cart" is a scatter chart, showing Motion Encoder vs iPhone; with Time [s] in the x-axis and Position [m] in the y-axis.. The x-axis shows values from -0.7655786350148368 to 12.765578635014837. The y-axis shows values from -0.07460153649786967 to 1.0354544237978696.