Edit chart
Loading graph
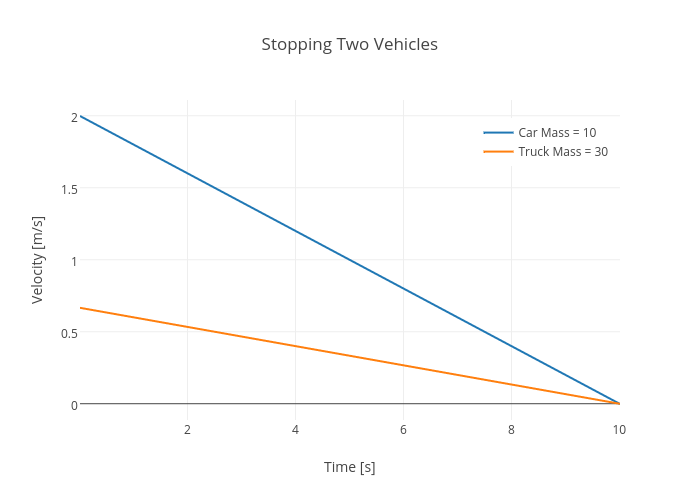
Rhettallain's interactive graph and data of "Stopping Two Vehicles" is a scatter chart, showing Car Mass = 10 vs Truck Mass = 30; with Time [s] in the x-axis and Velocity [m/s] in the y-axis.. The x-axis shows values from 0.01 to 10.009999999999831. The y-axis shows values from -0.11311111111107545 to 2.109111111111109.