Edit chart
Loading graph
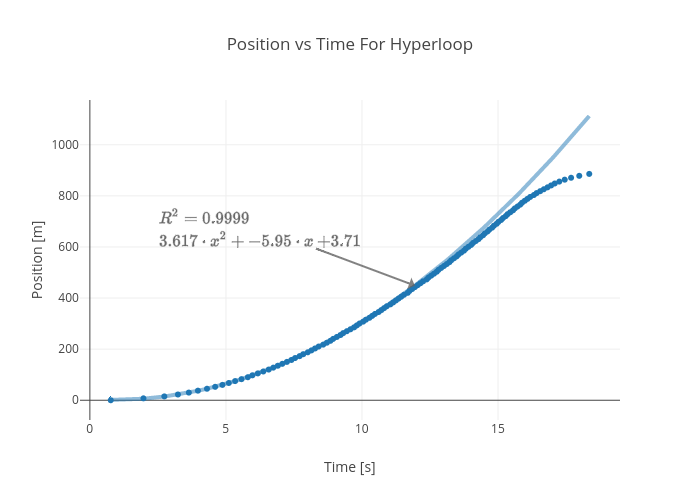
Rhettallain's interactive graph and data of "Position vs Time For Hyperloop" is a scatter chart, showing C; with Time [s] in the x-axis and Position [m] in the y-axis.. The x-axis shows values from -0.36172878246066065 to 19.48082878576066. The y-axis shows values from -83.47482456303044 to 1175.4897426171008. This visualization has the following annotation: $$R^2 = 0.9999\\3.617\cdot{ x}^{2}+-5.95\cdot x+3.71$$