Edit chart
Loading graph
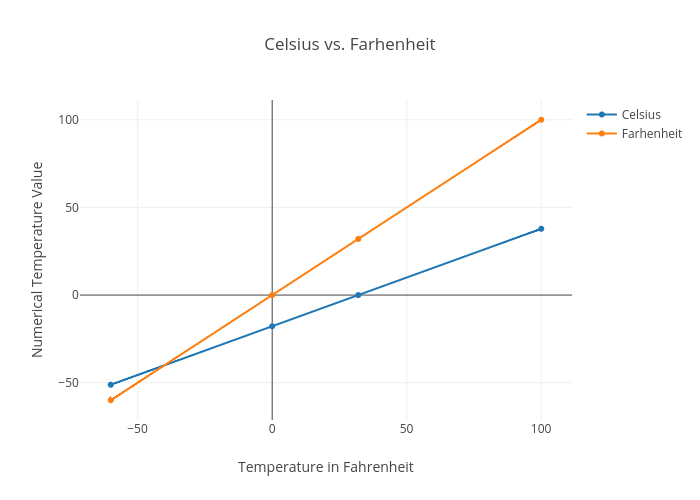
Rhettallain's interactive graph and data of "Celsius vs. Farhenheit" is a line chart, showing Celsius vs Farhenheit; with Temperature in Fahrenheit in the x-axis and Numerical Temperature Value in the y-axis.. The x-axis shows values from -70.0597119775202 to 110.0597119775202. The y-axis shows values from -71.68765743073048 to 111.68765743073048.