Edit chart
Loading graph
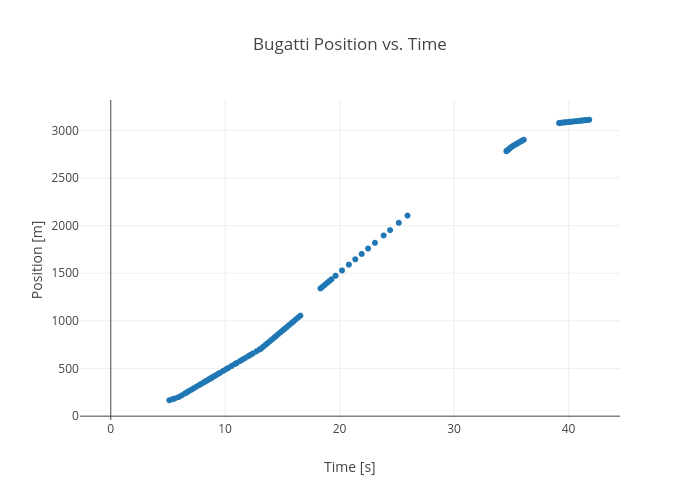
Rhettallain's interactive graph and data of "Bugatti Position vs. Time" is a scatter chart, showing B; with Time [s] in the x-axis and Position [m] in the y-axis.. The x-axis shows values from -2.6257013416971593 to 44.425701341697156. The y-axis shows values from -48.125944584382864 to 3327.125944584383.