Edit chart
Loading graph
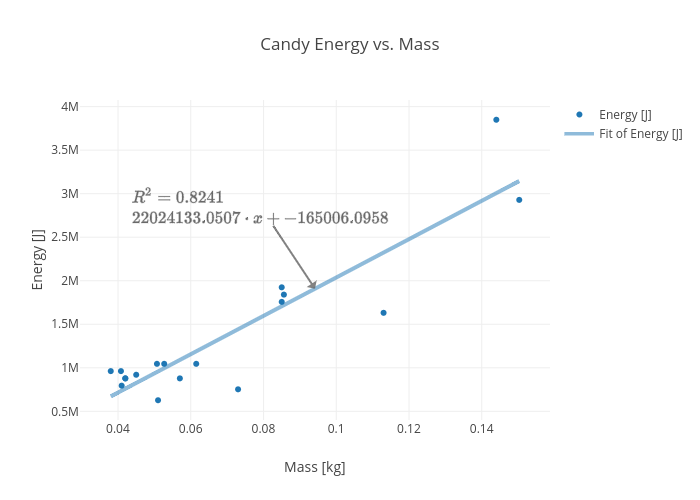
Rhettallain's interactive graph and data of "Candy Energy vs. Mass" is a scatter chart, showing Energy [J]; with Mass [kg] in the x-axis and Energy [J] in the y-axis.. The x-axis shows values from 0.030724750830564786 to 0.15757524916943522. The y-axis shows values from 383104.5192776964 to 4093775.4807223035. This visualization has the following annotation: $$R^2 = 0.8241\\22024133.0507\cdot x+-165006.0958$$