Edit chart
Loading graph
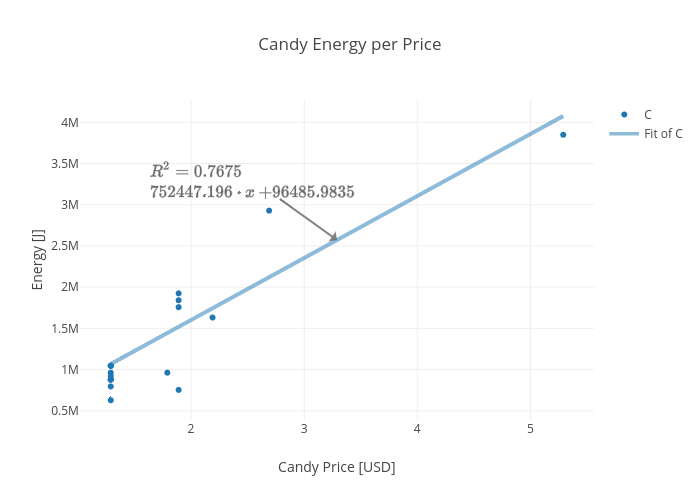
Rhettallain's interactive graph and data of "Candy Energy per Price" is a scatter chart, showing C; with Candy Price [USD] in the x-axis and Energy [J] in the y-axis.. The x-axis shows values from 1.033840358379149 to 5.546159641620851. The y-axis shows values from 370532.6280306384 to 4272005.282999728. This visualization has the following annotation: $$R^2 = 0.7675\\752447.196\cdot x+96485.9835$$