Edit chart
Loading graph
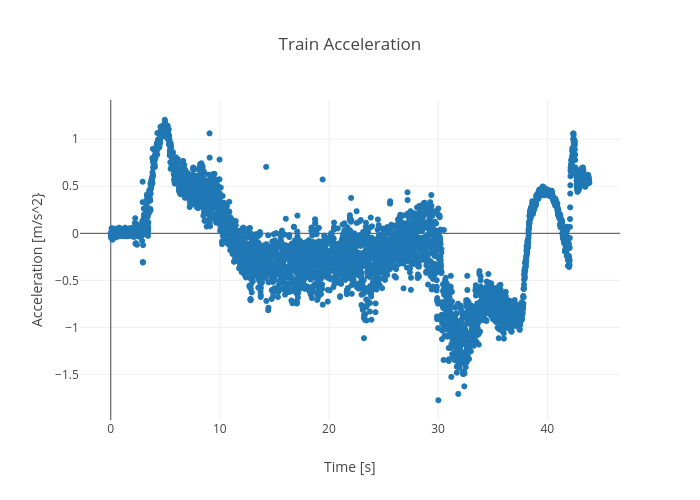
Rhettallain's interactive graph and data of "Train Acceleration" is a scatter chart, showing C; with Time [s] in the x-axis and Acceleration [m/s^2} in the y-axis.. The x-axis shows values from -2.7405554141591435 to 46.57478666415915. The y-axis shows values from -1.9888795558903456 to 1.4215788198903456.