Edit chart
Loading graph
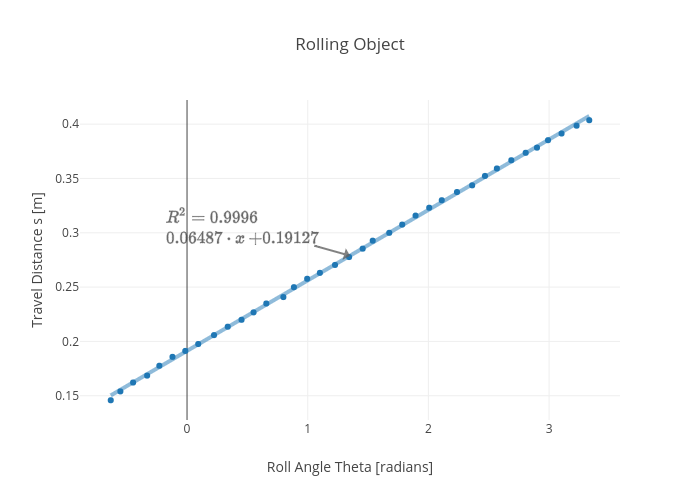
Rhettallain's interactive graph and data of "Rolling Object" is a scatter chart, showing C; with Roll Angle Theta [radians] in the x-axis and Travel Distance s [m] in the y-axis.. The x-axis shows values from -0.8805541891118925 to 3.5814810986118926. The y-axis shows values from 0.127356794518288 to 0.42223184545207654. This visualization has the following annotation: $$R^2 = 0.9996\\0.06487\cdot x+0.19127$$