Edit chart
Loading graph
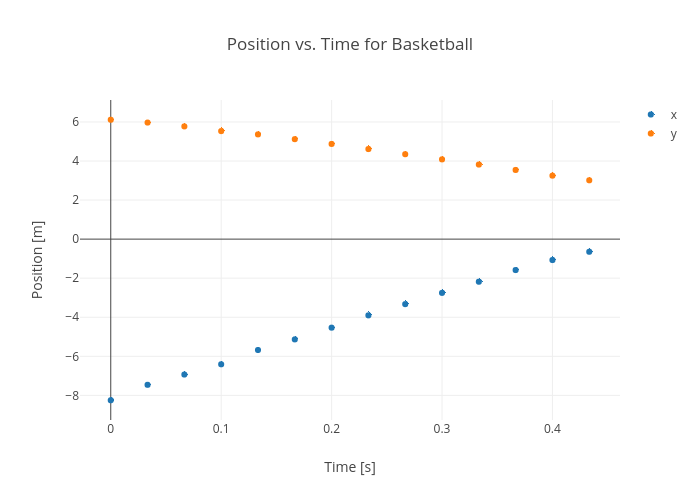
Rhettallain's interactive graph and data of "Position vs. Time for Basketball" is a scatter chart, showing x vs y; with Time [s] in the x-axis and Position [m] in the y-axis.. The x-axis shows values from -0.026897018970189687 to 0.4602303523035227. The y-axis shows values from -9.255418644230938 to 7.117471793066384.