Edit chart
Loading graph
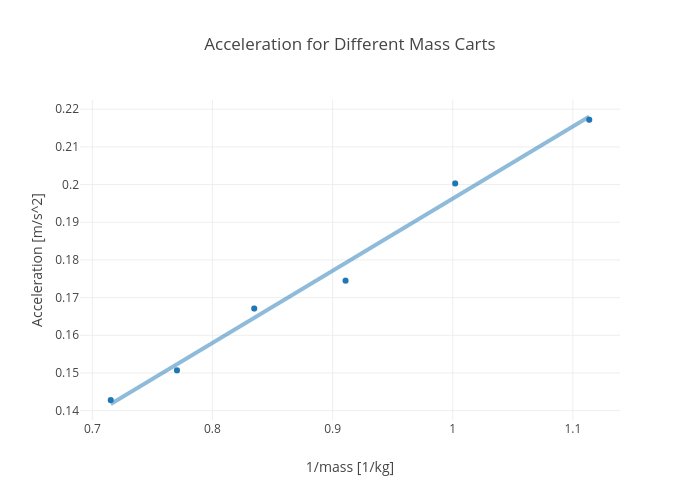
Rhettallain's interactive graph and data of "Acceleration for Different Mass Carts" is a scatter chart; with 1/mass [1/kg] in the x-axis and Acceleration [m/s^2] in the y-axis.. The x-axis shows values from 0.6906936561835976 to 1.1382711750164023. The y-axis shows values from 0.13678102189781022 to 0.2232189781021898.