Edit chart
Loading graph
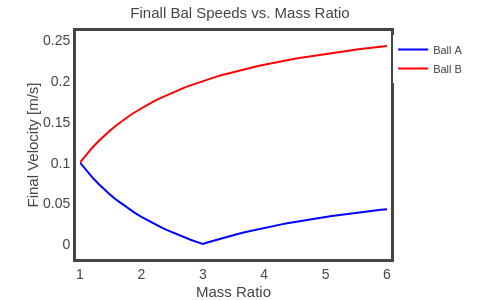
Rhettallain's interactive graph and data of "Finall Bal Speeds vs. Mass Ratio" is a line chart, showing Ball A vs Ball B; with Mass Ratio in the x-axis and Final Velocity [m/s] in the y-axis.. The x-axis shows values from 1 to 5.999999999999996. The y-axis shows values from -0.01344490855294828 to 0.2566583002643662.