Edit chart
Loading graph
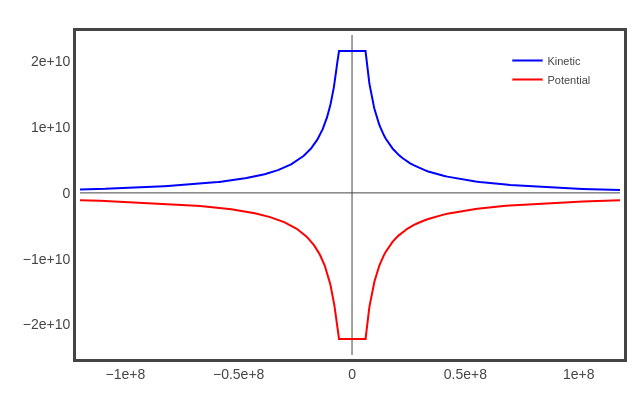
Rhettallain's interactive graph and data of "1D Gravity Assist with Stationary Planet" is a line chart, showing Kinetic vs Potential; with Position [Re] in the x-axis and Energy [Joules] in the y-axis.. The x-axis shows values from -120000000 to 118218001.05468805. The y-axis shows values from -24667974485.86268 to 24024848564.72424.