Edit chart
Loading graph
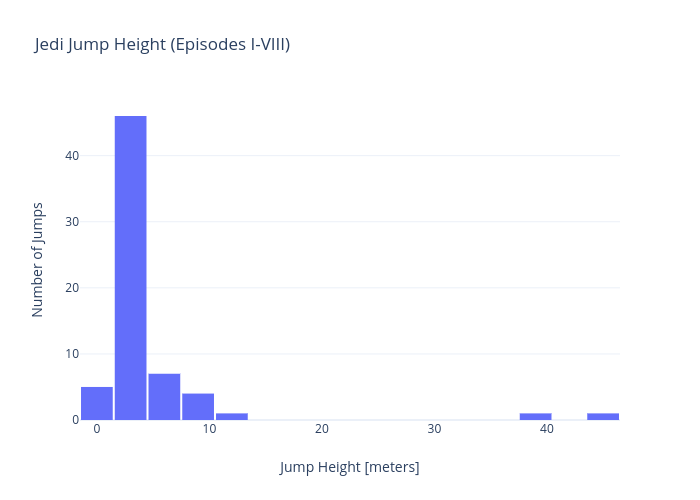
Rhettallain's interactive graph and data of "Jedi Jump Height (Episodes I-VIII)" is a histogram; with Jump Height [meters] in the x-axis and Number of Jumps in the y-axis.. The x-axis shows values from -1.5 to 46.5. The y-axis shows values from 0 to 48.421052631578945.