Edit chart
Loading graph
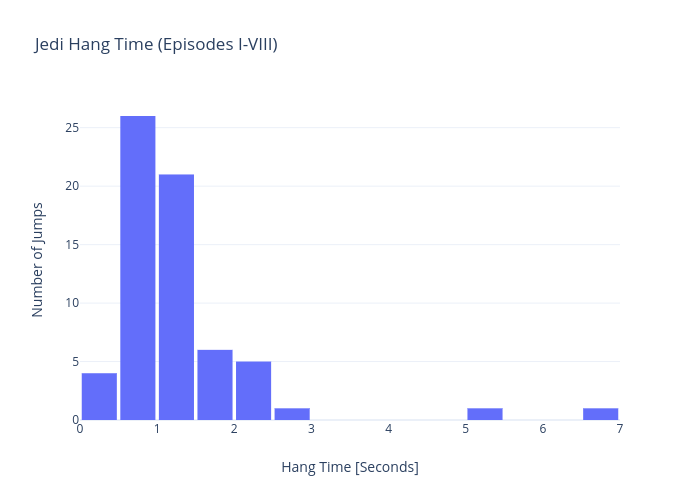
Rhettallain's interactive graph and data of "Jedi Hang Time (Episodes I-VIII)" is a histogram; with Hang Time [Seconds] in the x-axis and Number of Jumps in the y-axis.. The x-axis shows values from 0 to 7. The y-axis shows values from 0 to 27.36842105263158.