Edit chart
Loading graph
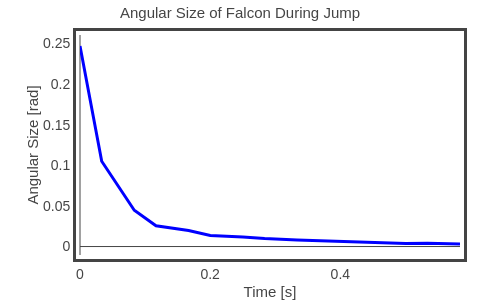
Rhettallain's interactive graph and data of "Angular Size of Falcon During Jump" is a line chart; with Time [s] in the x-axis and Angular Size [rad] in the y-axis.. The x-axis shows values from 0 to 0.5839. The y-axis shows values from -0.010435522859333335 to 0.26048446088733335.