Edit chart
Loading graph
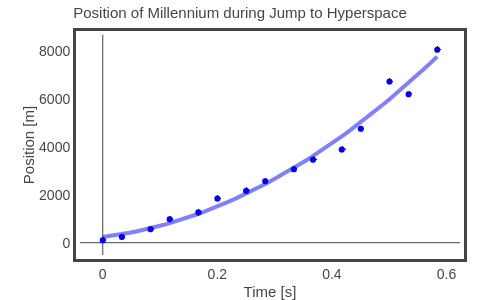
Rhettallain's interactive graph and data of "Position of Millennium during Jump to Hyperspace" is a scatter chart; with Time [s] in the x-axis and Position [m] in the y-axis.. The x-axis shows values from -0.03971218236173393 to 0.6236121823617339. The y-axis shows values from -513.2362519419639 to 8651.830256818314.