Edit chart
Loading graph
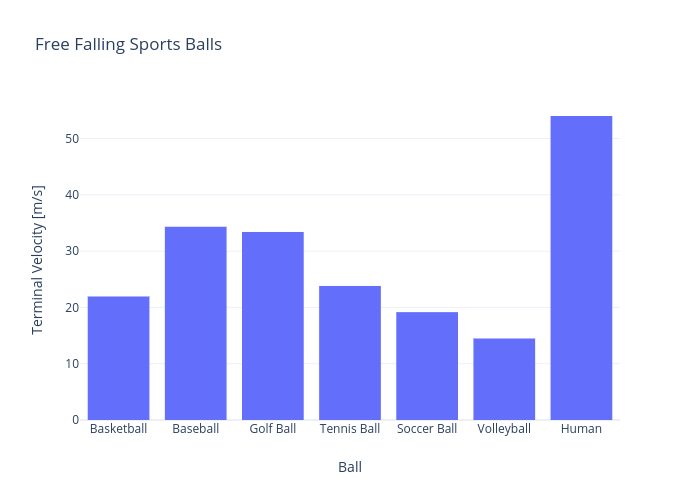
Rhettallain's interactive graph and data of "Free Falling Sports Balls" is a bar chart; with Ball in the x-axis and Terminal Velocity [m/s] in the y-axis.. The x-axis shows values from -0.5 to 6.5. The y-axis shows values from 0 to 56.8421052631579.