Edit chart
Loading graph
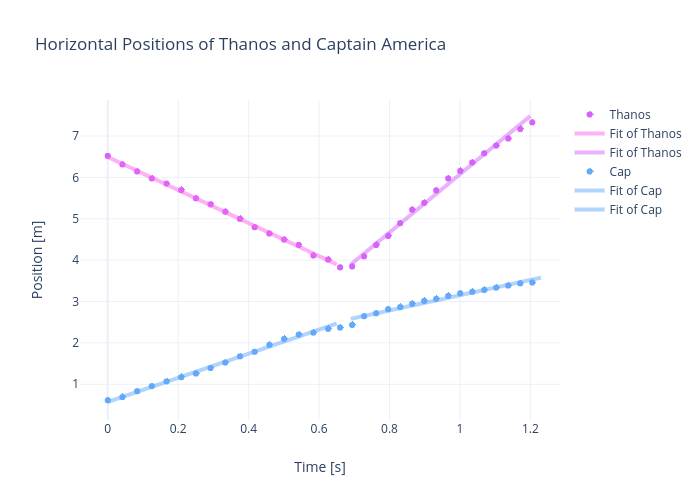
Rhettallain's interactive graph and data of "Horizontal Positions of Thanos and Captain America" is a scatter chart, showing Thanos vs Cap; with Time [s] in the x-axis and Position [m] in the y-axis.. The x-axis shows values from -0.07487021138403402 to 1.280195211384034. The y-axis shows values from 0.08061955624645634 to 7.873607237029461.