Edit chart
Loading graph
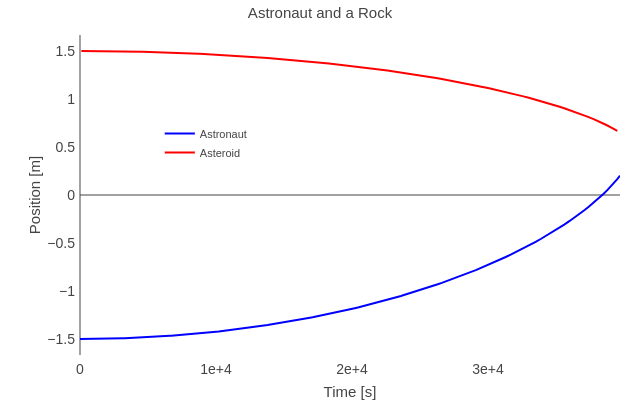
Rhettallain's interactive graph and data of "Astronaut and a Rock" is a line chart, showing Astronaut vs Asteroid; with Time [s] in the x-axis and Position [m] in the y-axis.. The x-axis shows values from 0 to 39700. The y-axis shows values from -1.6666662549382716 to 1.6666588438271606.