Edit chart
Loading graph
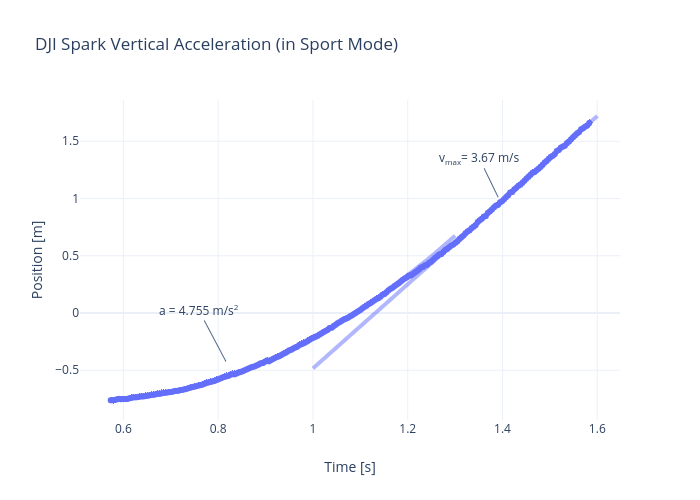
Rhettallain's interactive graph and data of "DJI Spark Vertical Acceleration (in Sport Mode)" is a scatter chart; with Time [s] in the x-axis and Position [m] in the y-axis.. The x-axis shows values from 0.5110144996506613 to 1.6453239351319475. The y-axis shows values from -0.9524844430471057 to 1.8613040656551987. This visualization has the following annotations: a = 4.755 m/s2; vmax= 3.67 m/s