Edit chart
Loading graph
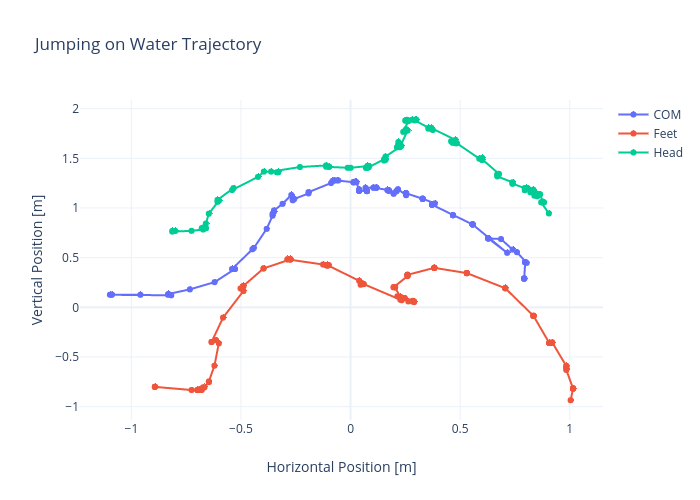
Rhettallain's interactive graph and data of "Jumping on Water Trajectory" is a , showing COM, Feet, Head; with Horizontal Position [m] in the x-axis and Vertical Position [m] in the y-axis.. The x-axis shows values from -1.229010880155829 to 1.146251933155829. The y-axis shows values from -1.153432648291822 to 2.106029722491822.