Edit chart
Loading graph
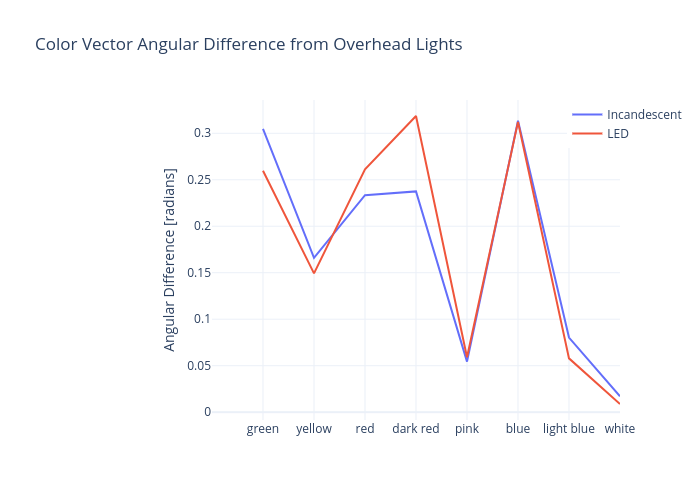
Rhettallain's interactive graph and data of "Color Vector Angular Difference from Overhead Lights" is a line chart, showing Incandescent vs LED; with Angular Difference [radians] in the y-axis. The x-axis shows values from 0 to 8. The y-axis shows values from -0.008431787048444448 to 0.3357964141604445.