Edit chart
Loading graph
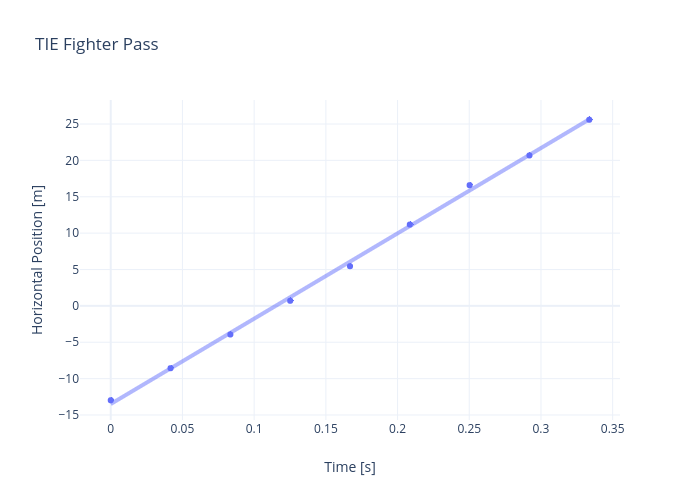
Rhettallain's interactive graph and data of "TIE Fighter Pass " is a scatter chart; with Time [s] in the x-axis and Horizontal Position [m] in the y-axis.. The x-axis shows values from -0.020603135681378948 to 0.3542698023480432. The y-axis shows values from -15.963892517371864 to 28.578654942235715.