Edit chart
Loading graph
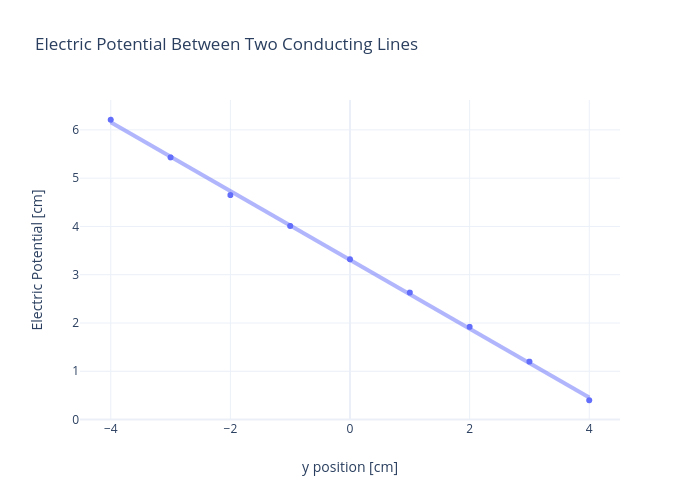
Rhettallain's interactive graph and data of "Electric Potential Between Two Conducting Lines" is a scatter chart; with y position [cm] in the x-axis and Electric Potential [cm] in the y-axis.. The x-axis shows values from -4.493981275078021 to 4.493981275078021. The y-axis shows values from -0.05356293895191777 to 6.663562938951918.