Edit chart
Loading graph
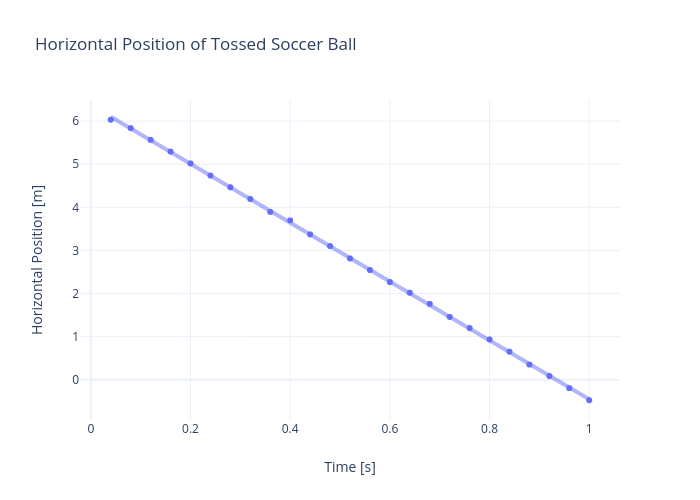
Rhettallain's interactive graph and data of "Horizontal Position of Tossed Soccer Ball" is a scatter chart, showing Fit of trace 0; with Time [s] in the x-axis and Horizontal Position [m] in the y-axis.. The x-axis shows values from -0.019441136051305527 to 1.0594411360513056. The y-axis shows values from -0.9549850126480157 to 6.509965552196435.