Edit chart
Loading graph
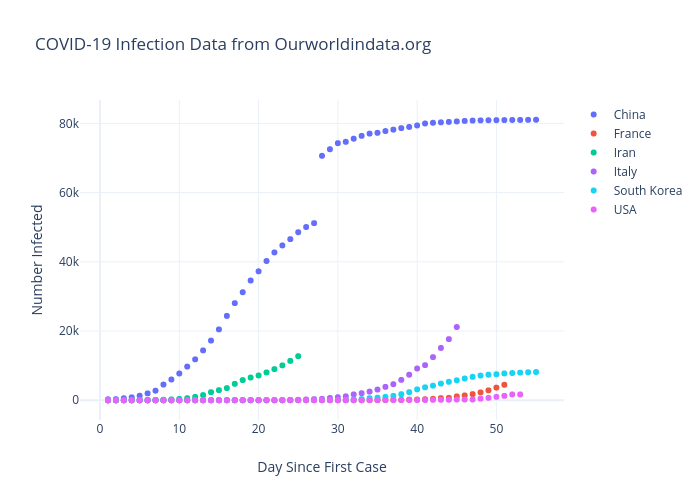
Rhettallain's interactive graph and data of "COVID-19 Infection Data from Ourworldindata.org" is a scatter chart, showing China, France, Iran, Italy, South Korea, USA; with Day Since First Case in the x-axis and Number Infected in the y-axis.. The x-axis shows values from -2.3231365790607503 to 58.32313657906075. The y-axis shows values from -5632.920435510889 to 86681.9204355109.